Table of Contents
Introduction
On October 24, Intel launched its new Core Ultra 200S series processors. These CPUs, featuring Intel’s new Lion Cove and Skymont cores, represent a fundamental change in how Intel designs its processors; much like AMD or Intel’s mobile processors, these CPUs are constructed from a number of discrete chiplets that individually contain cores, graphics, I/O, or so forth. The processors also feature Intel’s Alchemist-based Arc graphics and its last-gen NPU 3.0.
In our Content Creation Performance review, we found the processors to offer a fine generational uplift in content creation applications, but the performance gains are application-specific and not always present. More concerningly, in some applications, Intel experienced a regression in performance. Although not something we test, gaming performance has been found to be particularly uninspiring for this generation as well. However, Intel has primarily marketed these processors as increasing multithreaded performance at the same power draw and maintaining lightly threaded performance while significantly reducing power draw. That is something we did not cover in our initial launch review, but we want to dive into it in this article.

Image
Below, we’ve created a table of the current-gen 200S series processors (excluding “F” SKUs), the current-gen AMD Ryzen desktop processors, and the last-gen Intel 14th Generation processors.
| Processor | TDP | PL1* | Cores (Threads) | Frequency |
|---|---|---|---|---|
| AMD Ryzen 9 9950X | 170 W | ~199 W | 16 (32) | 5.7 GHz |
| Intel Core i9-14900K | 125 W | 253 W | 8P + 16E (32) | 6 GHz |
| Intel Core i7-14700K | 125 W | 253 W | 8P + 12E (28) | 5.6 GHz |
| Intel Core Ultra 9 285K | 125 W | 250 W | 8P + 16E (24) | 5.7 GHz |
| Intel Core Ultra 7 265K | 125 W | 250 W | 8P + 12E (20) | 5.5 GHz |
| Intel Core i5-14600K | 125 W | 181 W | 6P + 8E (20) | 5.3 GHz |
| Intel Core Ultra 5 245K | 125 W | 159 W | 6P + 8E (14) | 5.2 GHz |
| AMD Ryzen 9 9900X | 120 W | ~156 W | 12 (24) | 5.6 GHz |
| AMD Ryzen 7 9700X | 65 W | ~87 W | 8 (16) | 5.5 GHz |
| AMD Ryzen 5 9600X | 65 W | ~87 W | 6 (12) | 5.4 GHz |
*For Intel, based on the recommended “Performance” power profile.
Power Settings
As we’ve discussed elsewhere, there are a lot of technologies on modern CPUs which serve to increase performance. While some of these are classified as overclocking, others are not. For this testing, following our standard for our reviews, we disable overclocking features but keep most other performance-boosting features enabled.
Specifically, for AMD, we disable ASUS MCE (Multicore enhancement) and AMD PBO (Precision Boost Overdrive) but keep Precision Boost enabled. We also run memory at the maximum supported JEDEC frequency.
For Intel 14th Gen, we run the processors using the “Intel Performance” profile in the BIOS. We ensured that ABT and MCE were disabled and ran the memory at the maximum supported JEDEC frequency. This is slightly different from our past practices with Intel 14th gen, where we would configure PL1 = 125 W, in line with Intel’s alternative Performance power specification. However, for the sake of power comparisons, it seemed most fair to run these tests with PL1 = 253 W.
For Intel Core Ultra (“Series 2”), we selected the “Intel Performance Profile” in the BIOS. As Intel no longer lists a lowered PL1 = 125 W as part of the “Performance” specification, we left PL1 = 250 W. We used a kit of 6400 XMP memory with timings set to JEDEC specifications to approximate the performance from the 6400 Mbps CUDIMMs these processors support, though we plan on investigating memory scaling in the future.
Test Setup
Intel Core Ultra Test Platform
| CPUs: Intel Core Ultra 9 285K Intel Core Ultra 7 265K Intel Core Ultra 5 245K |
| CPU Coolers: Noctua NH-U12A |
| Motherboard: Gigabyte Z890 Aorus Pro Ice BIOS: F9b |
| RAM: 2x G.SKILL Trident Z5 DDR5-6400 32GB (64 GB total) Running at 6400 Mbps |
| GPU: NVIDIA GeForce RTX 4080 16GB Driver: Studio 565.90 |
| PSU: Super Flower LEADEX Platinum 1600W |
| Storage: Samsung 980 Pro 2TB |
| OS: Windows 11 Pro 64-bit (22621) |
Intel Core 14th Gen Test Platform
| CPUs: Intel Core i9-14900K |
| CPU Coolers: Noctua NH-U12A |
| Motherboard: ASUS ProArt Z690-Creator WiFi BIOS: 3901 Microcode: 0x12B |
| RAM: 2x DDR5-5600 32GB (64 GB total) |
| GPU: NVIDIA GeForce RTX 4080 16GB Driver: Studio 565.90 |
| PSU: Super Flower LEADEX Platinum 1600W |
| Storage: Samsung 980 Pro 2TB |
| OS: Windows 11 Pro 64-bit (26100) |
AMD Ryzen Test Platform
| CPUs: AMD Ryzen 9 9950X |
| CPU Coolers: Noctua NH-U12A |
| Motherboard: ASUS ProArt X670E-Creator WiFi BIOS Version: 2403 AGESA v Combo AM5 PI 1.2.0.2 |
| RAM: 2x DDR5-5600 32GB (64 GB total) |
| GPU: NVIDIA GeForce RTX 4080 16GB Driver: Studio 565.90 |
| PSU: Super Flower LEADEX Platinum 1600W |
| Storage: Samsung 980 Pro 2TB |
| OS: Windows 11 Pro 64-bit (26100) |
Benchmark Software
| Photoshop 25.12 – PugetBench for Photoshop 1.0.1 |
| Premiere Pro 24.6.3 – PugetBench for Premiere Pro 1.0.2 |
| Cinebench 2024 |
| Blender 4.0.0 |
Our test setup for this is identical to that used in our recent Intel Core Ultra 200S Content Creation Review. Like there, we decided to stick with the Noctua cooler for all our processors, as we did not see any signs of thermal throttling in our workloads in our open-air test benches. It is possible we could still see slightly improved performance with a large AIO, and it may be something we investigate in the future, but as of now, we do not find it necessary with our setup. We will note that we currently configure our Core Ultra workstations with AIOs as, when used inside a somewhat airflow-constrained case alongside a high-TDP GPU (RTX 4090), we found the Noctua air cooler to be unable to prevent thermal throttling under full combined CPU and GPU loads.
Due to time constraints, we were only able to test one of the last-gen Intel and one of the current Ryzen processors. In the future, we would like to include results for more processors. Nonetheless, we can draw fairly good representative conclusions based on those processors and our previous looks at power draw for Intel 14th Gen and Ryzen 9000.
For benchmarks, we looked at four from our standard suite to represent various types of workloads. We choose Photoshop as a representative “real-world” workflow that is relatively lightly threaded. This can stand as a good proxy for a lot of applications that only make use of a few CPU cores most of the time, and which have a variety of types of work in them, from waiting on something to finish to working in real-time. For a mixed workload, we selected Premiere Pro, which has portions that are single-threaded, multi-threaded, and GPU-constrained. We also tested with Cinebench, which, while somewhat more synthetic, is an industry-standard CPU benchmark that is fairly taxing on processors. Finally, we ran the Blender benchmark as a representative heavily-threaded workload. However, due to some quirks of that benchmark, we won’t be focusing on it heavily in this article, and we could not compare the Ryzen part.
Looking for a Content Creation Workstation?
We build computers tailor-made for your workflow.
Don’t know where to start?
We can help!
Get in touch with our technical consultants today.
Impact of the Windows Power Profile
One thing we discovered early on in our Arrow Lake testing, and that has been noted in some reviews, is the large performance difference between the Windows High Performance and Balanced power profiles. Reportedly, this is only a big impact on Windows 11 24H2, but we haven’t tried running the CPUs on earlier Windows versions to confirm this. This is fairly atypical behavior, as the High-Performance power plan usually has little to no difference in application performance for most CPUs. In the past, we have only seen it have an effect on some Xeon processors.

Image
For every processor we tested apart from the 200S series, the performance difference between Balanced and High Performance was, at most, about 1%, with any disparity being negligible. In short, it doesn’t matter. However, with the Core Ultra 2 parts, the impact ranged from non-existent (in heavily multithreaded applications) to minor (in mixed workloads) to very large (in lightly threaded, CPU-bound workloads). Of particular note was Photoshop, where, for the 285K, the power profile was responsible for up to a 20% difference in performance!
During our testing, we also had issues, at times, with the iGPU functioning properly when accelerating workflows via Intel Quick Sync. We believe this is due to power-saving features downclocking some portion of the iGPU, interconnect, cache, or CPU core working on the task; setting the power plan to High Performance helped solve the performance issue, as did disabling C-States in the BIOS. You can see the effects of the poorly functioning iGPU in the Premiere Pro results, although we wouldn’t lay this wholly at the feet of the power profile, as sometimes it works properly regardless. We are hopeful that a Windows or microcode update will address this particular bug.
Ultimately, the power profiles in Windows are designed to reduce power draw in idle or light workloads. Given our testing, at idle, the 200S processors draw about 10 Watts in the Balanced mode and 15 Watts in High Performance (with about 2 of those Watts being due to the iGPU, so not present on a K-SKU processor). This is incredibly low for a desktop processor (for reference, the 14900K was 15 W and 28 W, and the 950X 28 W and 28 W, respectively), so we aren’t too concerned about the energy implications of using the High-Performance power profile.
Power Consumption


In many ways, actual CPU power draw is less important than the efficiency of the processor; a processor could draw almost no power, but if it cannot effectively perform calculations, that isn’t very useful. Nonetheless, the power draw informs the efficiency, temperature, power supply, and cooler of the CPU and the system overall. In their release announcements, Intel has made large claims about the reduced power draw of the new Arrow Lake processors, especially in lightly threaded applications, so we wanted to see how our results in content creation applications compared to its results in gaming.
As we already saw in the power profile section, Intel starts off with large power consumption improvements at idle, with average idle wattage decreasing by one-third (5 W) from the 14900K in the Balanced power profile, and 13 W in High Performance. Given the performance discrepancies for the 200S CPUs such that we would recommend operating the Core Ultra 2 parts in High Performance, this means that Intel is merely treading water, with idle power draw being the same between 14th Gen Balanced (since High Performance was not necessary for those models) and 200S series High Performance.
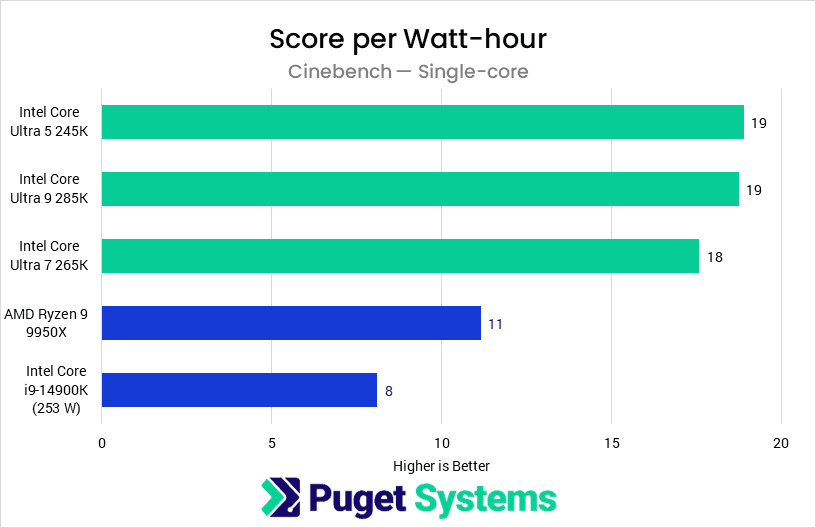
However, idle power draw is relatively unimportant compared to actual power draw when performing calculations. In Photoshop (chart #1), the Core Ultra parts see a reduced average power draw of 55% of the 14900K for the Ultra 7 and 9 parts and 45% for the Ultra 5 (though the 14600K was, typically, lower power draw than the 14900K). This is very close to much of Intel’s marketing claims of about half the power draw in many games. This also brings the power draw in applications like Photoshop below that of the 9950X, although much like the i9, the Ryzen 9 has never been the most efficient Ryzen CPU. We see similar, if slightly less impressive, reductions in Cinebench single-core (chart #4).
Premiere Pro (chart #2) has more portions that are both CPU-bound and not single-threaded, meaning we expect to see less overall power consumption savings than Photoshop. Here, the 285K draws 28% less power than the 14900K on average, with the 265K and 245K drawing 38% and 45% less, respectively. We can also see the maximum power draw difference here, with the 265K and 285K capping out at about 230 W, while the 245K only pulls 153 W. Interestingly, this is less power than the CPUs are theoretically supposed to pull (250 W and 159 W), but this has been consistent for us across all of our testing and power settings.
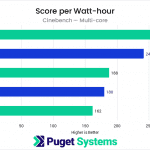
Cinebench multicore (chart #3) is an area where we would not expect a lower power draw, as the workload should pull as much power as possible from the CPUs, which have similar configured power limits. We see this hold true, with the Core Ultra 7 and 9 pulling about the same wattage as the 14900K (less about 20 W, as we noted above). The 245K also pulls just shy of its PL1 at 138 W, but all of these are essentially in line with power limits.
Performance per Watt-hour


Performance per Watt or performance per Watt-hour are the two most typical ways of measuring CPU efficiency. Both have their uses, but due to the type of tests we ran, performance per watt-hour is preferable. As a reminder, a Watt-hour is equal to the amount of energy required to provide one Watt of power for one hour; a 60 W incandescent bulb would use 60 Watt-hours of energy if turned on for an hour. Normalizing by energy rather than power lets us take into account the fact that, on workloads that do not have a fixed amount of time they run for, a processor can potentially use less energy overall by completing the workload more quickly.
In Photoshop (chart #1), the new Intel CPUs are much more efficient than the last-gen 14900K, with the 245K having 207% the performance per watt-hour and the 285K and 265K being only somewhat behind. They also surpass the 9950X by a healthy margin, though it is worth noting that the 9950X is much more performant in this workload—for most users, that performance benefit is likely more significant than the efficiency gains. Much like we saw in the last section, Cinebench single-core (chart #4) shows similar (but larger) gains as Photoshop, though in this case, the CPUs are both more efficient and more performant than the 14th Gen or Ryzen 9000 parts.
Premiere Pro (chart #2) is also very good for Intel, thanks in part to the iGPU-enabled Quick Sync, which accelerates some LongGOP (Interframe) codecs. The 285K is 56% more efficient than the 14900K based on our testing in this workflow, and the 245K is very similar. Our 265K has been a bit of a lemon and scores poorly here, largely due to the iGPU issues we discussed above. We think that the 265K should be very similar to the other Core Ultra 2 parts, but Intel needs to fix the (presumably driver) issues before we can consistently see that.
Our third chart looks at efficiency in the Cinebench multi-core benchmark. Here, the new Intel Core Ultra desktop processors are somewhat less impressive, especially the 245K. Intel’s new Ultra 9 285K does have a solid 44% performance per watt-hour increase, putting it slightly ahead of the 9950X, but the 265K is merely on par. The 285K appears to be able to make better use of the power budget made available to it due to the higher number of cores than the other 200S series. This benchmark, more than any others, would benefit from having results for the rest of Intel’s 14th Gen.
CPU Core Temperature


CPU temperature is a less comparable metric across CPU families, as it relies on the reported package temperature by a sensor located in the processor. However, this sensor is not always calibrated identically or located identically in the package across families, and even if it were, the implications of that temperature for the rest of the processor are not necessarily the same. Nonetheless, it is still a useful metric to examine as it is one of the primary metrics dictating CPU boosting and throttling algorithms. Although the design of the overall processor, the heat spreader, and the interface between the two affect temperature, given the same cooler, the primary driver should be the average power draw of the processor.
In the more lightly threaded applications (Photoshop, Premiere Pro, Cinebench single-core), the 200S processors maintain good average temperatures of around 50-60 °C. Max temperatures tend to be relatively volatile, but we still didn’t see anything above 90 degrees. In the multicore Cinebench workload, package temperatures were higher, at 70 and 80 °C for the 245K and 265K/285K, respectively. Again, maximum temperatures capped out at 92 °C, well below the maximum junction temperature of 105 °C. We did not see any reported thermal throttling, and the CPUs all maintained their advertised maximum boost clocks.
Conclusion
One of Intel’s stated goals with Arrow Lake was to increase the efficiency of its CPUs and reduce power draw across many, but not all, workloads. This is not a new refrain—Intel has made such claims in previous CPU launches, as did AMD with its Ryzen 9000 series processors. However, this time, Intel appears to have delivered.
Overall, in lightly and moderately threaded workloads, Intel sees an average power draw reduction of around 30%, bringing the processors well below the 14900K and 9950X. This corresponds to impressive performance per watt-hour improvements of 50-100%. In heavy all-core workloads, Intel draws slightly less power but still surpasses AMD by averaging 230 W on the higher-end SKUs. This still translates to good efficiency gains at the top end, but it won’t reduce the need for a good cooler.
Intel has managed to make impressive power draw reductions in light and moderately threaded workloads alongside solid efficiency gains in heavily multi-threaded applications. The overall performance gains leave something to be desired in many workflows (and especially in gaming), but given AMD’s similarly lackluster Ryzen 9000 launch, both manufacturers have something to offer in the content creation space.
Finding the perfect workstation doesn’t have to be complicated. Explore our solutions page for a curated selection of recommended systems for a multitude of applications and workflows, or visit our custom configuration page if you already know the ideal hardware for your needs. If you need assistance with tailoring a system to a unique workflow or have any other questions, we encourage you to reach out to our dedicated technology consultants.
Looking for a content creation workstation?
We build computers tailor-made for your workflow.
Don’t know where to start?
We can help!
Get in touch with one of our technical consultants today.